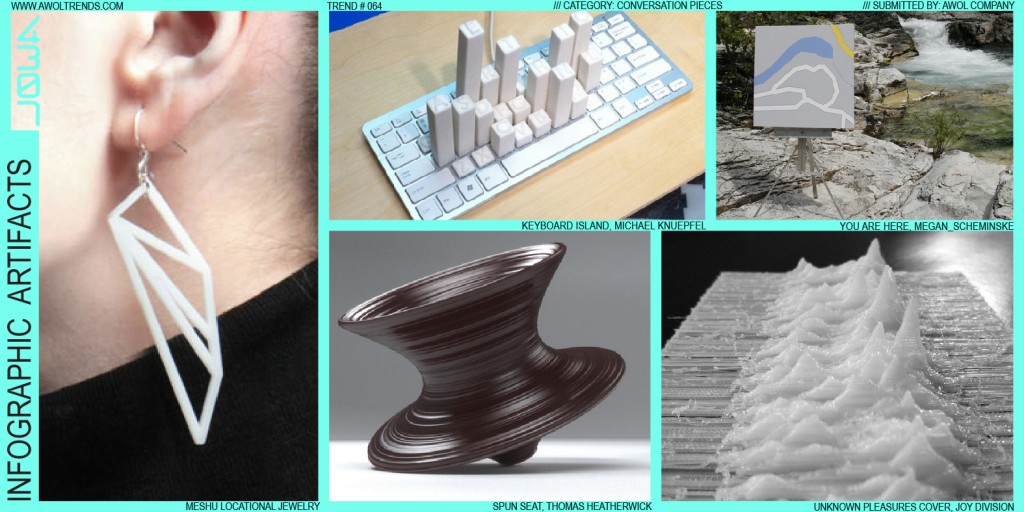
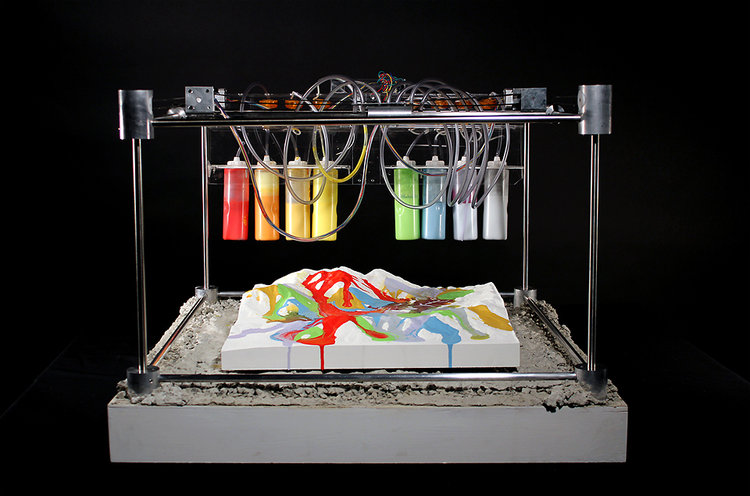
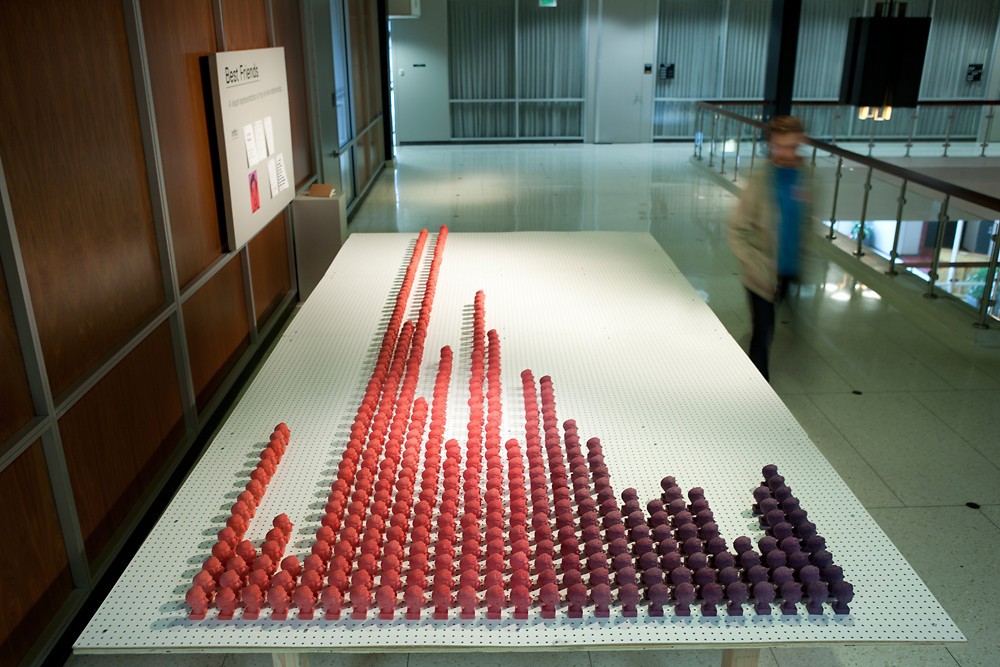
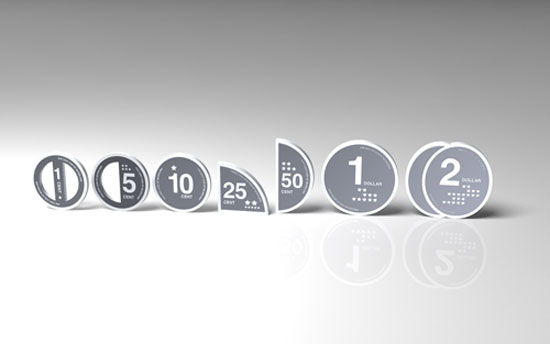
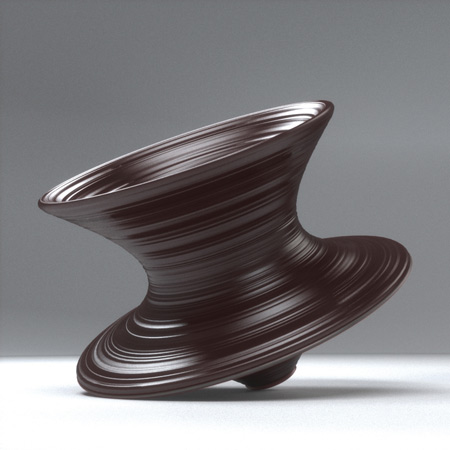
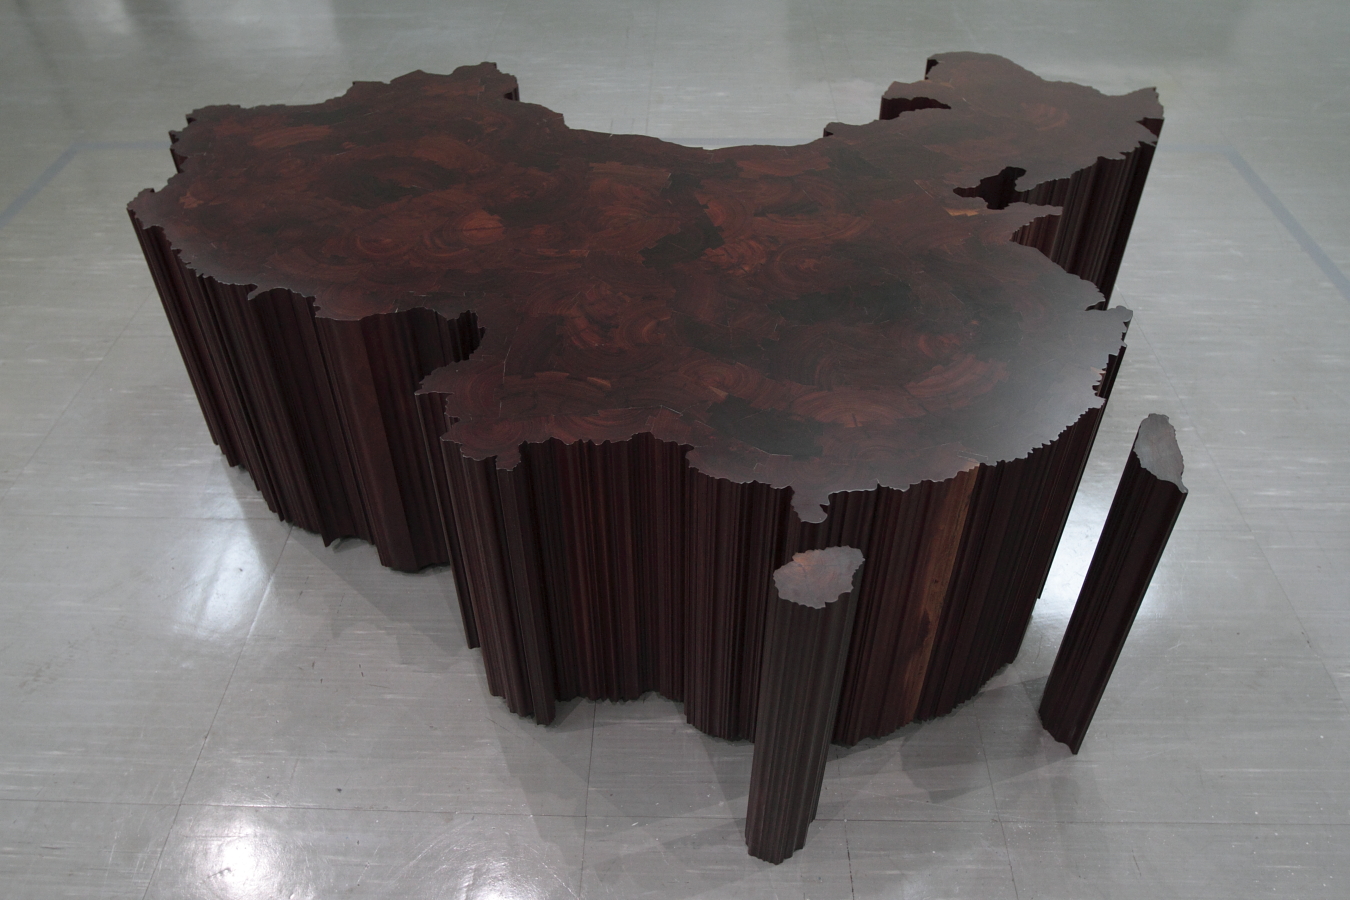
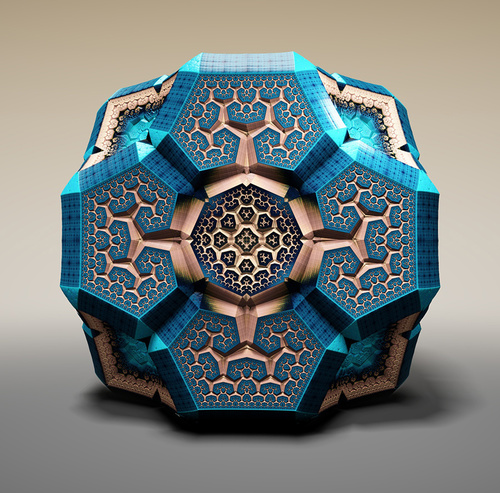
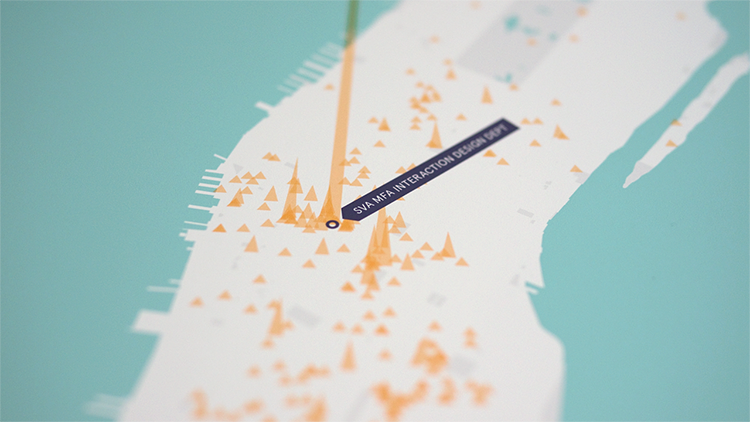
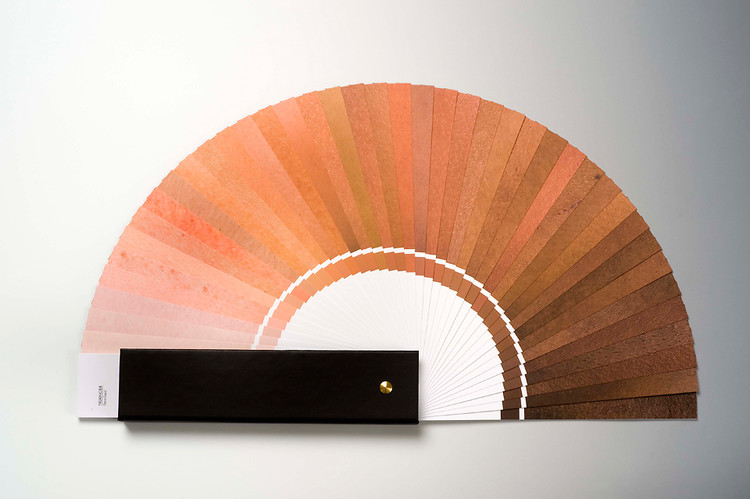
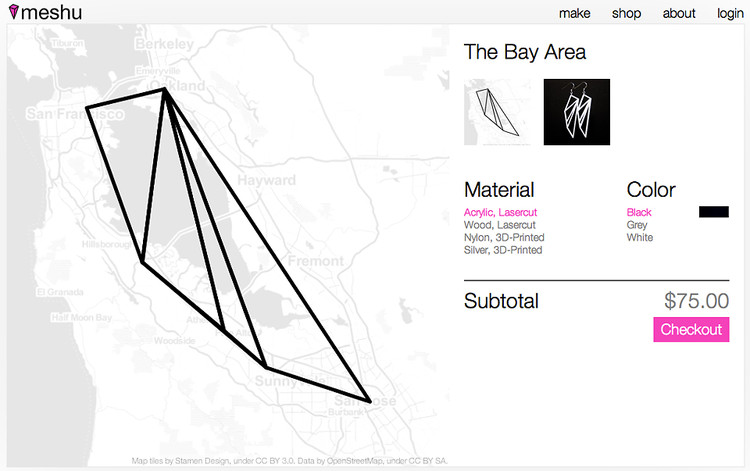
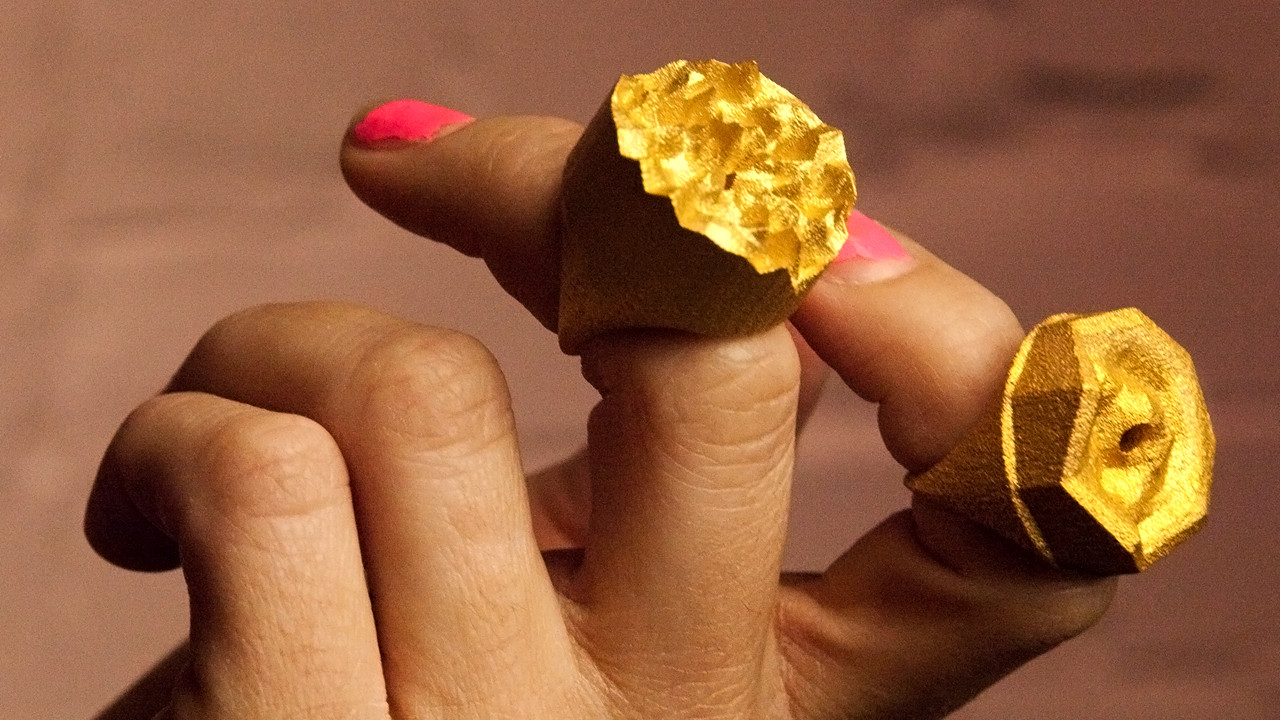
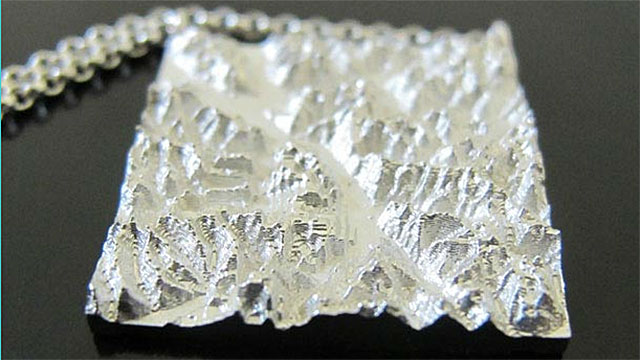
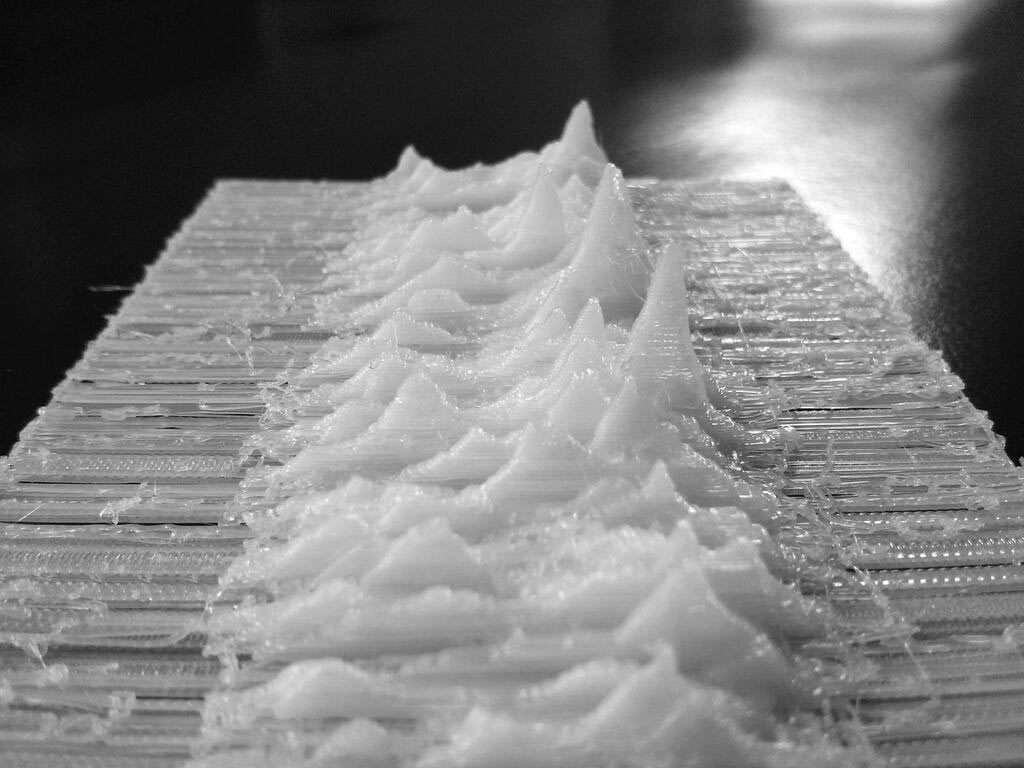
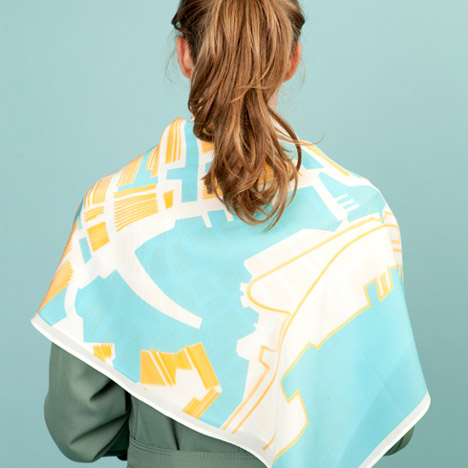
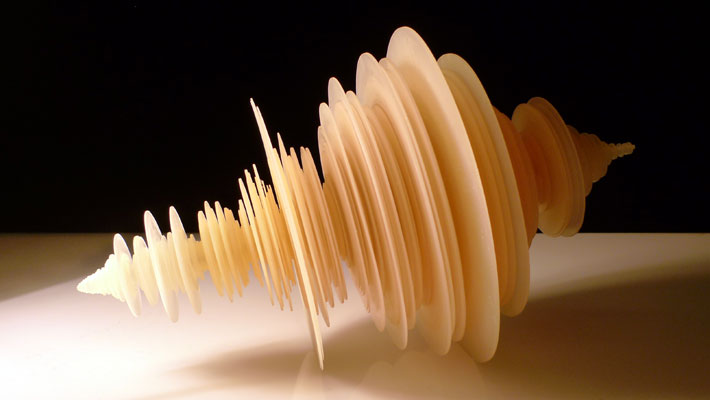
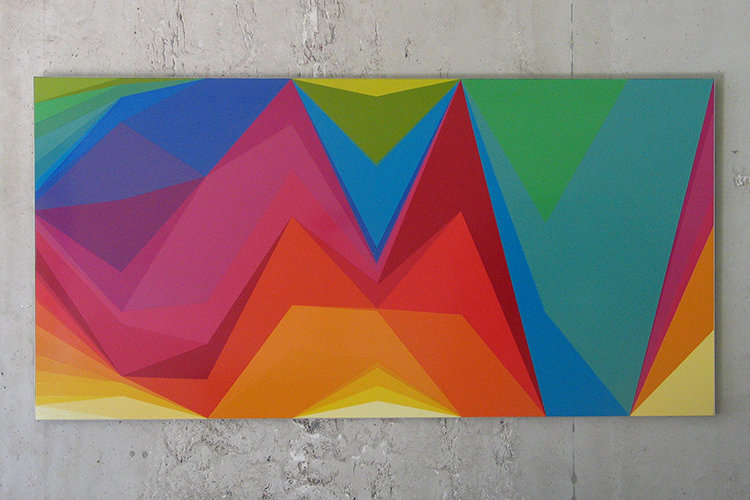
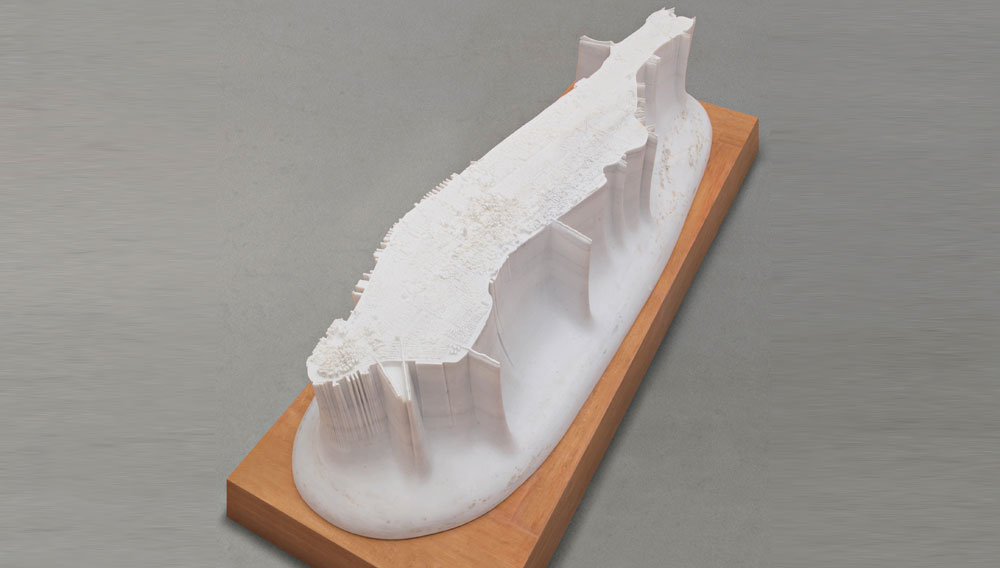
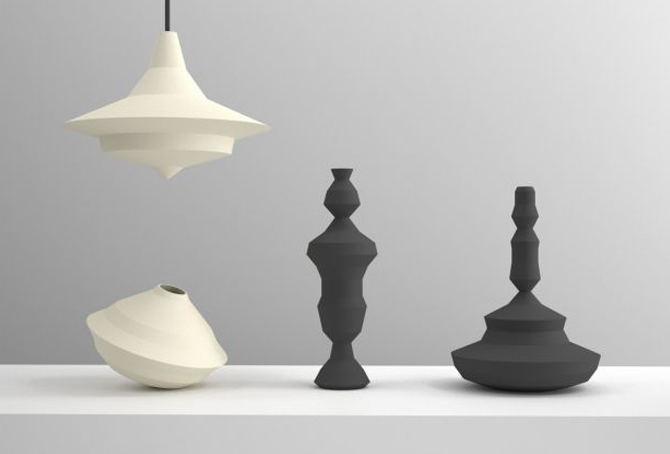
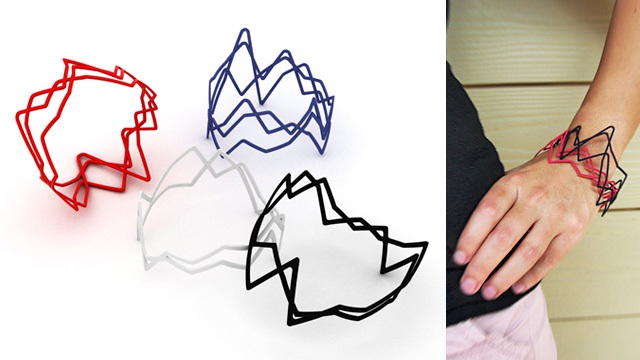
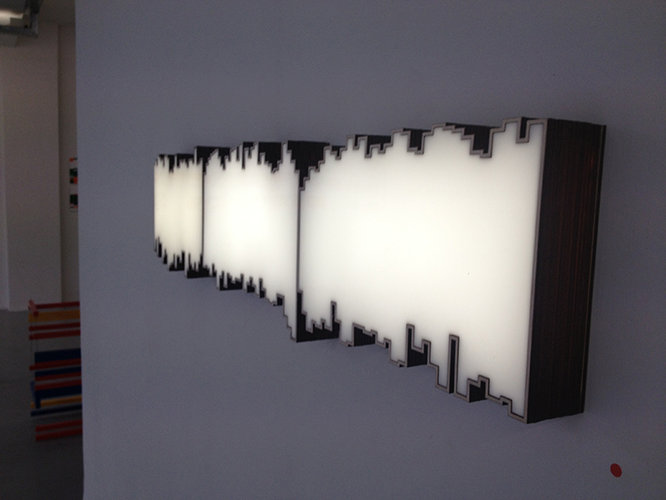
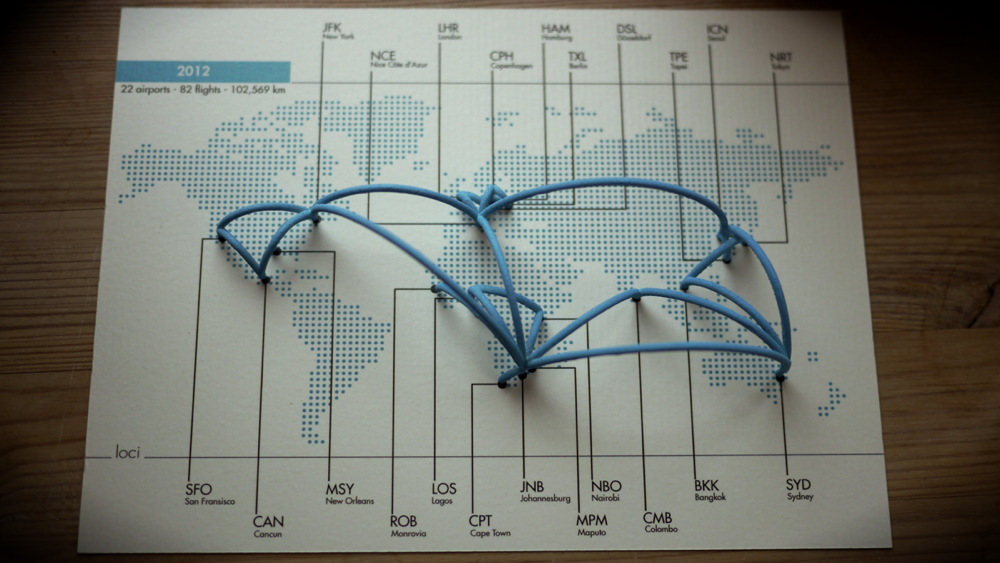
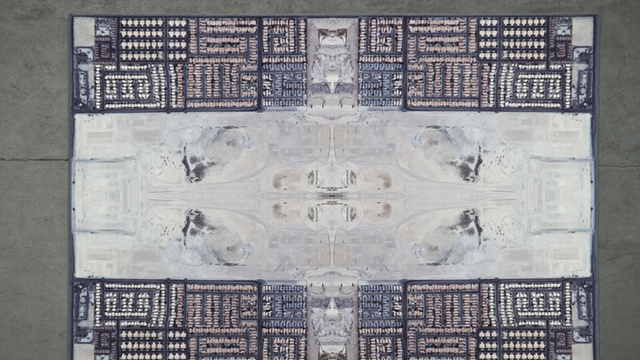
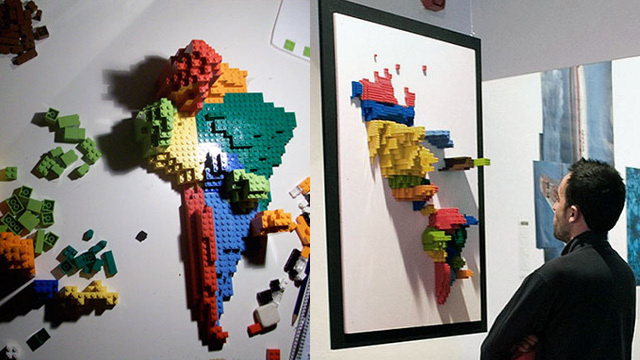
Many have said that Design is communication. Typically designers are trying to express elements of a brand’s values, or communicate a device’s functionality or proper method of use, or weave a narrative about the relevance of the object in a person’s life. Sometimes, “because it looks cool” is as deep as the communication goes. In very recent years, however, a new type of aesthetic theme has appeared wherein the object itself becomes a visual indicator of intangible data. Infographic Artifacts are physical representations of virtual information, at once existing as familiar objects (jewelry, smartphone cases, candle-holders) and also as embodiments of data sets (GPS locations, acoustic waveforms, world population data, etc.). These objects then have a strong and appealing duality, as their primary functionality (for example a coffee table) is enabled by the manifestation of a unique data set (your DNA profile). Designers using this stylistic mode have found a near-boundless source of material to work with: the big data sets that have grown increasingly accessible as our world becomes more digitized, and all possible metrics are being recorded. Vocal and musical waveforms, social media presence, geo-location, financial markets, geophysical data, worldwide demographics, these are just a few of the instances shown here embodied as Infographic Artifacts. This trend exists for now within the Conversation Pieces trend category, because for the moment that’s what these objects are: concepts meant to crystallize an immediate understanding of a bigger, less understandable, idea. But as data becomes more relevant for consumers, designers will likely find successful and marketable ways to fold this aesthetic theme into mass-consumer products. A car exterior that changes to depict a graphic of all places and destinations travelled, or a couch that changes color to show a family’s cumulative extent of sedentary TV watching: it’s not hard to envision how making big data tangible and immediate can impact people’s experiences and even guide their behavior for the better. So designers, now you finally have a reason to fire up Excel: get to work on those data sets!
INFOGRAPHIC ARTIFACTS


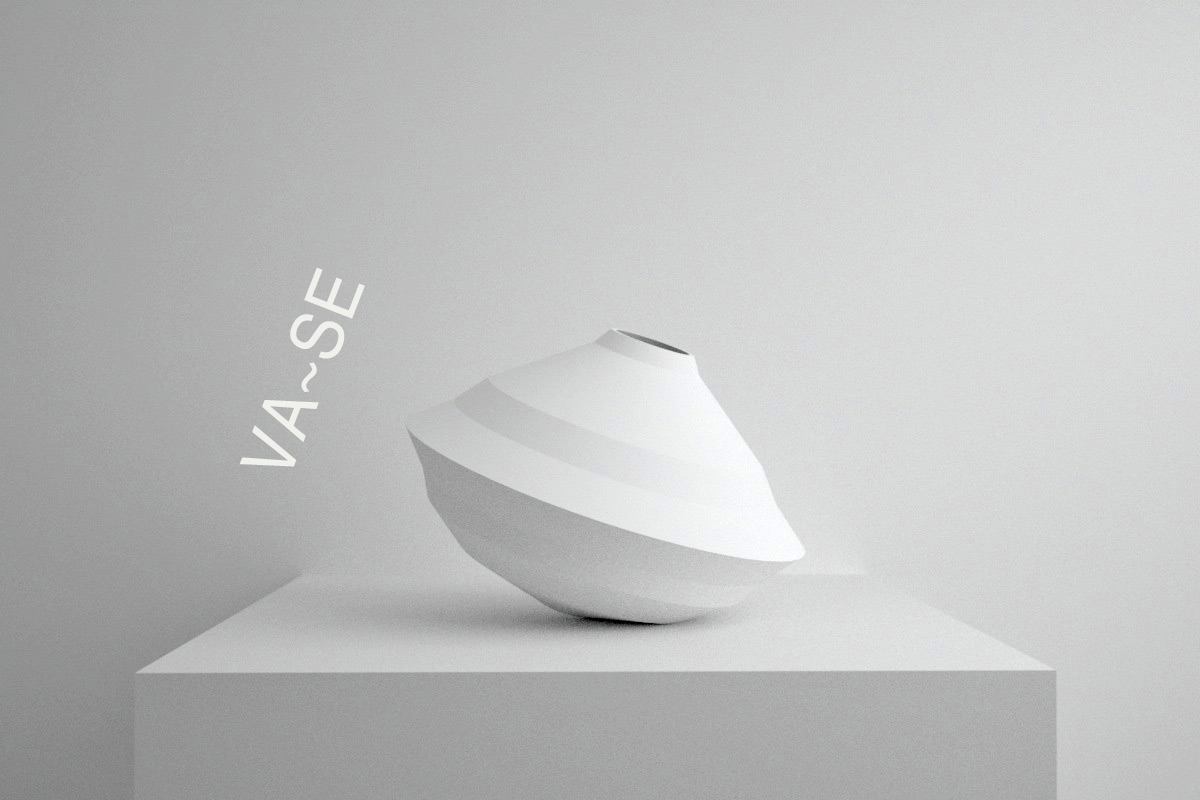


Wow, didnt even know this existed! I never would have thought about data being driving the form and design of a product like a vase.